The Russell 1000 Index, a benchmark for large-cap U.S. equities, has shown a mix of resilience and volatility over the past year. While the index has climbed past 3,800 points, sectoral divergences and macroeconomic pressures keep investors on their toes. In this brief, we walk through the key forces shaping the Russell 1000, how to interpret recent data, and what it means for portfolio construction.
Setting the Scene: What the Index Actually Measures
The Russell 1000 represents the largest 1,000 companies in the Russell 3000, covering roughly 92% of the U.S. equity market’s value. Unlike broader indices that mix all market caps, the Russell 1000 zeroes in on big‑name firms, making it a sensitive gauge of corporate earnings, investor sentiment, and economic momentum.
Why Investors Care
- Liquidity: These stocks trade in high volumes, which translates to tighter spreads and lower transaction costs.
- Diversification: Even within the large‑cap space, sector weighting allows for exposure to technology, finance, consumer staples, and more.
- Benchmarking: Many asset‑management funds benchmark their performance against the index, so it’s a yardstick for performance assessment.
Recent Trends: A Step‑by‑Step Analysis
To understand the current trajectory, let’s dissect the last 12 months in a structured way.
- Sector Rotation: Tech and industrials pulled ahead, delivering +12% and +9% respectively, while utilities lagged at -2%. This shift aligns with a cycle where growth‑oriented companies benefit from easing inflation and lower rates, whereas defensive sectors feel pressure from rising interest rates.
- Valuation Levels: Price‑to‑earnings ratios have crept back into the 20‑mid range from a historic low of 16, suggesting a partial re‑valuation of growth stocks.
- Macro‑Catalysts: The Federal Reserve’s policy stance—maintaining a 5% target range—has kept discount rates elevated. Corporate earnings reports show mixed results: high‑growth names still outpace peers, yet traditional manufacturers face supply‑chain constraints.
- Geopolitical Tensions: Recent trade friction signals have nudged risk‑aversion, leading to brief outflows from high‑beta sectors.
- ETF Activity: Net inflows into Russell‑1000‑based ETFs hit a record $30 billion in Q3, highlighting institutional confidence in the index’s breadth.
Implications: Turning Insight into Action
With these patterns in mind, investors can adopt a tactical stance that balances growth exposure with defensive safeguards.
Portfolio Construction Tips
- Allocate 60% to Core Large‑Caps: Focus on tech, healthcare, and consumer discretionary, which have driven recent upside.
- Add 20% of Defensive Holdings: Utilities, consumer staples, and certain financials can act as a hedge against rate spikes.
- Keep 20% in Cash or Cash Equivalents: This buffer allows for opportunistic buying if the index dips below a 12‑month moving average.
Monitoring Signals
Set up alerts on:
- Quarterly earnings surprises that exceed consensus by 5% or more.
- Federal Reserve minutes for changes in the 5% target range.
- Sector‑specific news that could shift beta exposure.
Risk Management
Use stop‑loss orders at 8% below purchase price to protect against sudden reversals, and consider sector‑specific ETFs to isolate risk.
Looking Ahead: What to Watch in the Next Quarter
Expect the index to continue its nuanced play:
- Interest Rate Sensitivity: Any tightening signal could weigh on tech and industrials.
- Supply Chain Recovery: Manufacturing sectors may rebound if logistics normalize.
- Geopolitical Developments: Trade policy changes will keep defensive sectors in the spotlight.
By systematically evaluating these forces, researchers can transform raw data into actionable insight—keeping the Russell 1000 a reliable compass in the ever‑shifting equity landscape.
Posters In Tom & Jerry Media | Tom And Jerry Wiki | Fandom
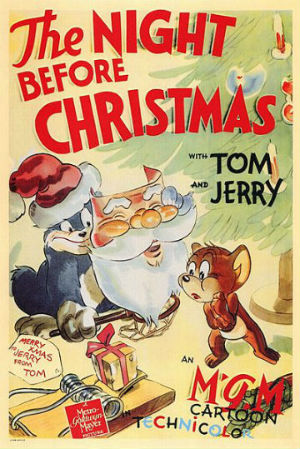
Posters in Tom & Jerry Media | Tom and Jerry Wiki | Fandom
Tom And Jerry Photos

Tom And Jerry Photos
Tom And Jerry The Movie Poster

Tom And Jerry The Movie Poster
El Show De Tom Y Jerry (2014) | Doblaje Wiki | Fandom

El show de Tom y Jerry (2014) | Doblaje Wiki | Fandom